How to Monitor and Manage an A/B Split Ad Campaign

Run enough marketing campaigns, and you realize that the ideas you think are great often aren't, and the ideas you're on the fence about sometimes blow away all expectations. In other words ... our guts aren't great predictors of success.
But do you know what will help you become a better predictor of success? A/B split testing.
A/B split testing is a way to compare two different versions of your campaign and see which one performs better. Here's how it works.
- Two Variations: You create two nearly identical ads, with just one element changed between them. This could be the headline, image, call to action (CTA), or even the overall design.
- Why do you just change one element at a time? Two reasons:
- Isolation: When you change multiple elements at once, it becomes impossible to isolate which specific change actually influenced the results. Imagine testing a new ad with a different image, headline, and CTA. If one ad performs better than the other, was it because the image grabbed more attention, the headline piqued more interest, or the CTA compelled action? You won't be able to know for sure.
- Clear Cause and Effect: Changing just one element at a time allows you to establish a clear cause-and-effect relationship. If the ad with the new headline gets more clicks, you know it's directly linked to the headline change. This allows you to pinpoint what's working and refine your approach strategically.
- Random Split: Once you decide which element you're testing, you divide your target audience into two groups (should should be a random split, to maintain the validity of the test). Each group sees only one version of the ad.
- Performance Monitoring: You track key metrics like clicks, conversions, or cost-per-acquisition (CPA) to see which ad variation performs better at achieving your campaign goals.
A/B splits deliver data-driven insights on what resonates more with your audience. This allows you to optimize your ad campaigns for better results and ultimately a higher return on investment (ROI).
Picture it Like a Relay Race
Running a successful advertising campaign often involves a series of A/B tests, optimizing each element for maximum impact. Each element test is a pair of runners, racing each other, and handing off the baton to the next two runners. But with a relay race, the runners know exactly when to hand off. How do you know when to stop monitoring one element in your A/B split campaigns and hand off to the next set of elements?
There's no set rule or timetable. Instead, you monitor the campaign and make decisions as you study the data. Here's how.
Keeping an Eye on the Data:
- Track Key Metrics: For each A/B test, identify relevant metrics based on your campaign goals. This could include clicks, conversions, cost-per-acquisition (CPA), or even downstream customer behavior like purchase value. Tools like Google Ads or your ad platform will provide this data.
- Visualize the Race: Utilize charts and graphs to see how each element test (generally referred to as "ad variations") performs over time. This helps identify trends and potential winners early on.
Knowing When to Call it Quits:
- Statistical Significance: Don't rely solely on initial impressions. Use statistical tests to determine if the observed difference between variations is statistically significant, meaning it's likely not due to random chance. Many A/B testing platforms offer built-in statistical analysis.
- Sample Size Matters: Be sure you have enough data to draw meaningful conclusions. Aim for a statistically significant result with a pre-determined confidence level (e.g., 95%). Your statistical tools (in your CRM, BI system, or ad management system) can often estimate the time needed to reach this point.
Looking Beyond the Numbers:
- Downstream Behavior: Don't just focus on initial conversions. Track how A/B tested elements influence customer behavior further down the funnel. For example, Form A might have a lower completion rate (conversions) but lead to higher-value purchases from those who complete it. Utilize website analytics tools or CRM data to understand this.
- Qualitative Feedback: Consider A/B testing headlines or CTAs. Here, user testing or surveys can provide valuable insights into user preferences beyond just click-through rates.
Here's an Example
Let's say you're A/B testing ad headlines.
- Monitoring: Track clicks and conversions for each ad variation. A graph shows that one headline consistently drives more clicks, but conversions are lower.
- Digging Deeper: Further analysis reveals the lower-converting ad attracts customers who spend more on average. Here, A/B testing might shift towards optimizing the landing page for these higher-value leads.
Remember: A/B testing is an iterative process.
- Stabilize Winners: Once you have a statistically significant winner for an element (ad, landing page, CTA), "freeze" that element and move on to the next test.
- Continuous Improvement: By systematically monitoring and analyzing data, you can continuously optimize your advertising campaign for maximum impact.
So there's your quick-and-dirty training on managin A/B split campaigns! Don't overthink it: On your next ad, decide an element to test (headline, or image, or even background color), and run two versions. As you study the numbers and reflect on their meaning, your understanding of the process will grow.
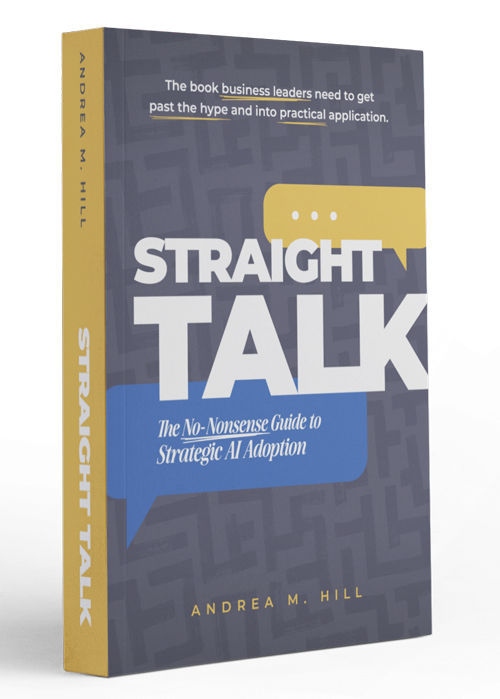
Andrea Hill's
Latest Book
Straight Talk
The No-Nonsense Guide to Strategic AI Adoption

Where other books focus on prompts and tools, this book gives business leaders what they actually need: the frameworks and confidence to lead AI adoption responsibly, without having to become technologists themselves.
Also available at independent booksellers and public libraries.
Are You Ready to Do Better Marketing?
WerxMarketing is all about performance marketing. That means giving you the tools you need to connect with customers, enable your sales efforts, and turn leads into loyal customers. Ready to learn more about how we do that? Book a free consult and bring your questions. See if you like working with us on our dime, and get some good advice in the process.